Aether’s Visual Symphony: TikTik’s Intricate Artistry in Crafting Health Narratives
In the enchanting realm of smartwatches, Aether, guided by TikTik’s brilliance, transcends data collection to orchestrate a visual symphony, transforming health metrics into a dynamic and nuanced narrative. This advanced data visualization isn’t just a display; it’s a meticulous art form that enriches user understanding and engagement. Let’s embark on a detailed exploration of how Aether achieves this visual prowess, turning raw data into a masterpiece of actionable insights.
1. The Dynamic Canvas of Ephemeral Trends:
a. Fluidity in Motion:
Aether captures the fluidity of health metrics, allowing users to witness the ebb and flow of well-being over distinct time frames. The visual representation is not static but a moving canvas of health dynamics.
b. Temporal Evolution:
Aether’s visual narrative evolves, presenting trends as temporal brushstrokes. Users can observe the changing hues of fitness, sleep, and stress levels, gaining a holistic and temporal perspective on their health journey.
c. Granular Timeframes:
Offering granularity in timeframes, Aether ensures users can zoom in or out to scrutinize daily, weekly, or monthly trends, fostering a detailed understanding of how health metrics fluctuate over varying periods.
2. Crafting Intuitive Narratives with Artistic Graphs:
a. Simplified Complexity:
Aether’s artistry lies in simplifying complex data without diluting its essence. Intuitive graphs and charts replace the rigidity of traditional representations, offering users a visually digestible journey through the intricacies of their health metrics.
b. Multidimensional Visuals:
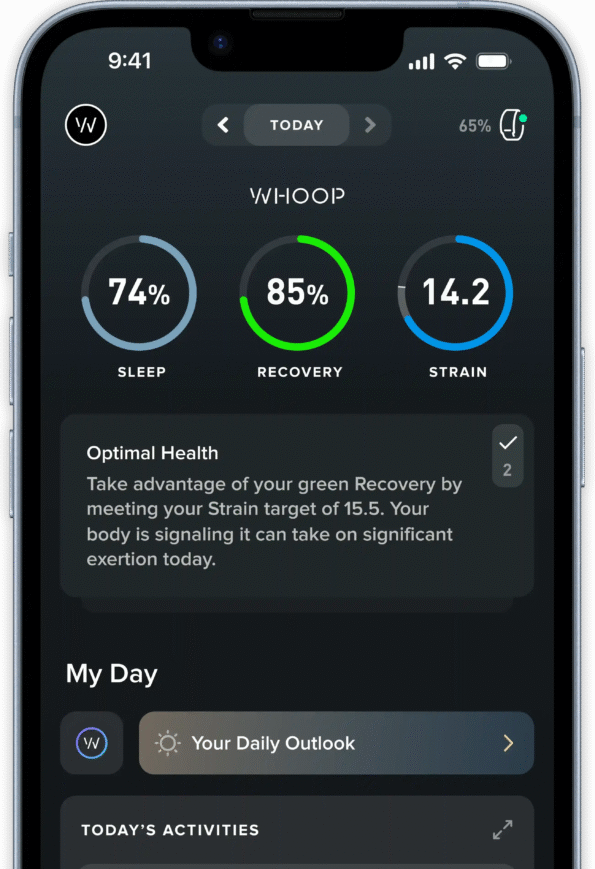
Aether’s visuals are multidimensional, offering layers of information in a single glance. Whether tracking heart rate, sleep patterns, or activity levels, users can discern multiple facets of their health status simultaneously.
c. User-Defined Configurability:
Recognizing individual preferences, Aether allows users to configure the visual representation according to their preferences, ensuring a personalized and user-centric experience in interpreting health data.
3. Interpreting the Symphony of Trends with TikTik:
a. Personalized Data Harmonization:
TikTik doesn’t merely interpret; it harmonizes trends with a personalized touch. Each user’s health narrative is unique, and TikTik ensures that the interpretation aligns with the individual’s specific context and goals.
b. Contextualized Insights:
Going beyond generic analysis, TikTik contextualizes insights based on a user’s historical data, offering a deeper understanding of how current trends relate to past health patterns.
c. Real-time Adjustment:
TikTik dynamically adjusts interpretations in real-time, ensuring that insights stay relevant and adaptive as users embark on different health journeys or make lifestyle changes.
4. The User Experience Epiphany:
a. Decoding the Visual Lexicon:
Aether’s advanced data visualization empowers users to decode a visual lexicon of well-being. It’s not about decoding cryptic numbers; it’s about interpreting a symphony of visual elements that tell the story of one’s health.
b. Interactive Engagement:
Aether invites users into an interactive engagement with their health data. Through touch and gesture controls, users can explore specific data points, encouraging a hands-on and participatory experience.
c. Gamification Elements:
To enhance user motivation, Aether incorporates gamification elements within its visual narratives, turning health tracking into a dynamic and enjoyable experience with rewards, challenges, and achievements.
5. Moving Milestones:
a. Continuous Celebration:
Visualizing progress isn’t a static achievement; it’s a moving milestone. Aether transforms health improvement into a kinetic tableau, a continuous celebration that propels users forward in their quest for wellness.
b. Goal Tracking and Adjustments:
Aether’s visual storytelling includes goal tracking with the ability to set and adjust objectives. Users can visualize their journey towards specific health goals and make informed adjustments as needed.
c. Social Sharing:
Encouraging a sense of community, Aether facilitates the sharing of visual milestones on social platforms, turning individual achievements into collective celebrations and fostering a supportive network.
In Concert: Aether and TikTik’s Visual Mastery in Detail:
In the collaboration between Aether and TikTik, health data becomes a visual masterpiece. The meticulous attention to detail, from dynamic trends to artistic graphs, transforms the Aether Smartwatch into more than a device—it becomes a conductor of visual narratives, a sophisticated companion that curates and interprets the health symphony of its users. Step into a detailed experience of smartwatch innovation, where every data point is not just seen but understood, felt, and celebrated in the enchanting visual poetry crafted by Aether and TikTik.

